l한글l
구독자 3명구독중 34명
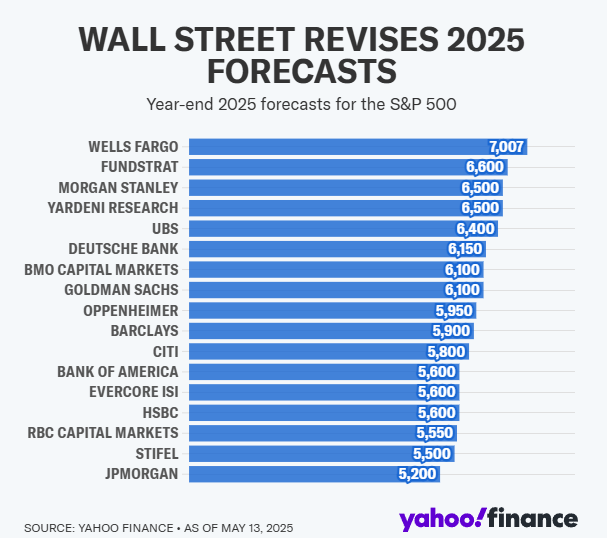
메크로 기본편을 공부하다가 문득 그런생각이 들었다. 하락장은 예상하지 못하지만 반등장은 예상할수 있지 않을까..? Chat GPT와 함께 하락장과 그리고 반등장에 대해서 알아보았다.
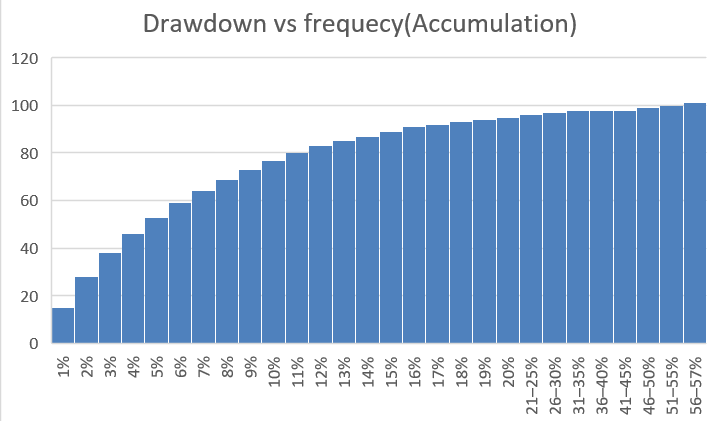
일단, 전고점 대비 1%,2%... 최대하락폭이 나온 경우와 각 경우의 포제션을 정리해 보았다. 아래의 경우를 보면 전고점 대비 10%이하 떨어진 경우가 하락경우의 약 80%를 차지했다. 한마디로 10%정도 떨어지면 반등할 확률이 80%라는 소리이다.
그러면 10% 이상이 되는 경우에 대해서 찾아봤다 (전체 하락 경우의 약 20%). 케이스는 금본위제가 해지된 1971년 이후로 찾아봤고 아래와 같은 결과가 나왔다. 구분을 할때
Apr 28 – Nov 23, 1971 (−13.9%)
Monetary turbulence following Nixon's end of gold convertibility. Wage-price controls, inflation fears. Largely a technical correction.
Jan 11, 1973 – Oct 3, 1974 (−48.2%)
Oil embargo and stagflation. OPEC crisis, Watergate scandal, high inflation and recession drove a severe bear market.
Nov 7 – Dec 6, 1974 (−13.6%)
Aftershock of 1973–74 bear. No new crisis; profit-taking and uncertainty. Considered a technical correction.
Jul 15 – Sep 16, 1975 (−14.1%)
Post-recession correction. Inflation remained high; early expansion led to a technical pullback.
Sep 21, 1976 – Mar 6, 1978 (−19.4%)
Prolonged decline during stagflation and dollar weakness under Carter. Policy uncertainty and poor investor sentiment.
Sep 12 – Nov 14, 1978 (−13.6%)
Dollar crisis and inflation fears. Emergency rate hikes to rescue the dollar.
Oct 5 – Nov 7, 1979 (−10.2%)
V...