AI 프롬프트 - 비용 구조 테스트

퀄리티기업연구소
2026.01.27조회수 89회
퀄리티기업연구소
구독자 1,408명구독중 112명
"투자의 질을 중시하며, 장기적 안목으로 시장을 바라봅니다. 비단 재테크뿐만 아니라 인생 전반에 걸쳐 복리의 힘을 믿고, 그 원칙을 실천에 옮기는 곳입니다. 여기서는 깊이 있는 분석과 지속 가능한 성장 전략을 공유하며, 함께 성장하는 지혜를 나눕니다."
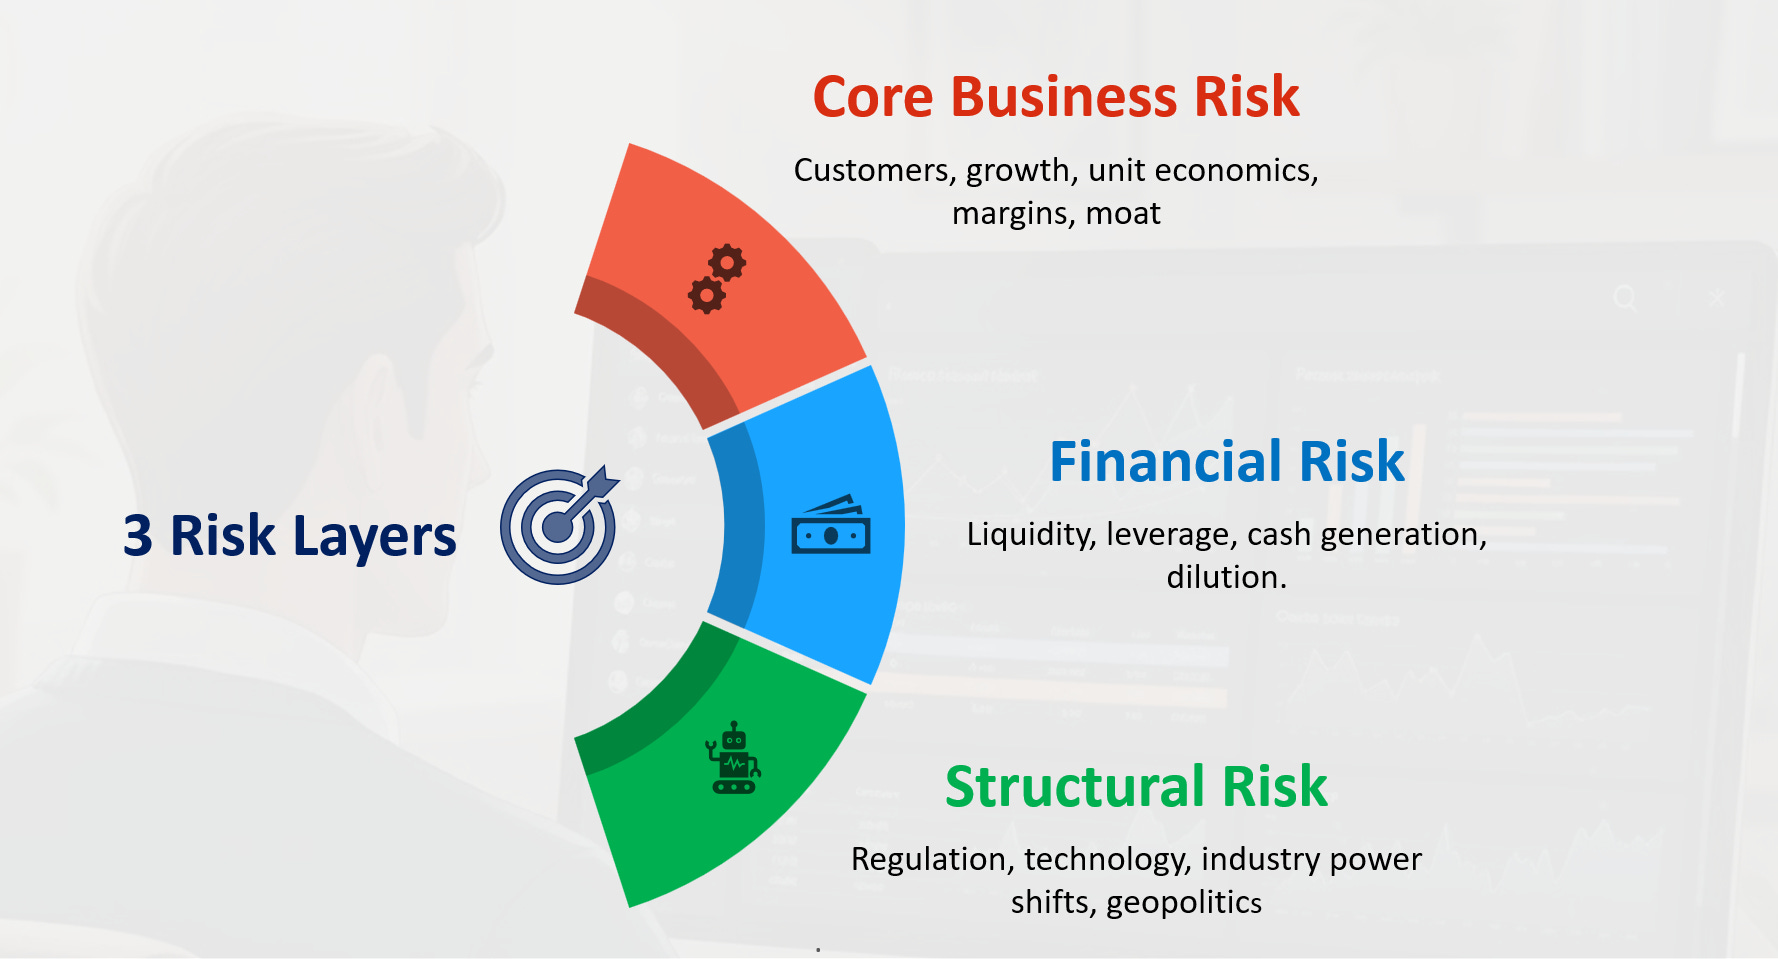
질문: 이 비즈니스는 구조적 운영 레버리지를 가지고 있는가?
일부 비즈니스는 인력을 고용하거나 자산을 추가함으로써 규모를 키웁니다.
매출 증가 → 비용 증가 → 마진 유지(정체)
반면, 어떤 비즈니스는 이미 구축된 것을 기반으로 규모를 확장합니다.
매출 증가 → 비용 안정 → 마진 확대
고정비 지불 완료: 이미 초기 투자가 완료되어 추가 비용 발생이 적음.
인원수보다 빠른 매출 성장: 직원 한 명당 창출하는 수익이 급격히 증가함.
내장된 유통망 (Built-in distribution): 마케팅이나 영업 비용을 추가로 들이지 않고도 확산 가능한 구조.
이 단계의 목적: "이 비즈니스의 규모가 두 배로 커질 때, 비용의 몇 퍼센트가 고정된 상태로 유지되는가?"라는 질문에 답하기 위함입니다.
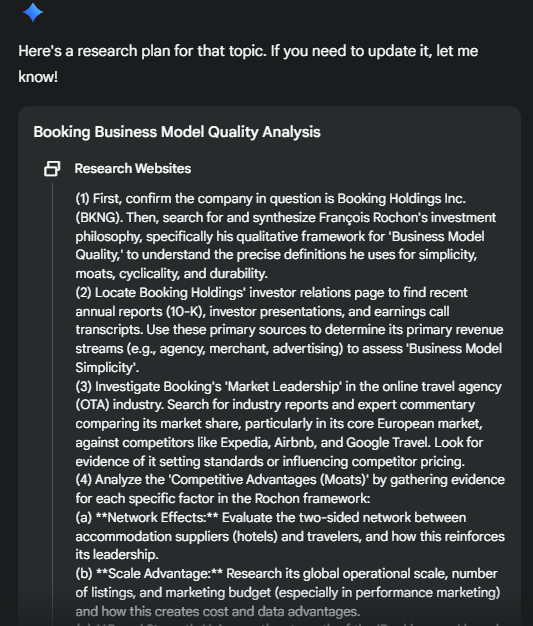
Gemini 또는 다른 LLM을 딥 리서치(Deep Research) 모드로 실행합니다.
아래의 프롬프트를 복사하여 붙여넣습니다.
[COMPANY NAME] 부분을 분석하고자 하는 회사명으로 바꿉니다.
실행합니다.
ROLE
You are an experienced long-term investor focused on business quality and operating leverage.
YOUR JOB
Assess whether [INSERT COMPANY NAME] has structural operating leverage based on its cost structure and scaling mechanics.
OBJECTIVE
Conduct a Cost Structure Test covering at least the last 5–10 years.
Determine whether operating leverage is structural or temporary, and how it compares to industry norms.
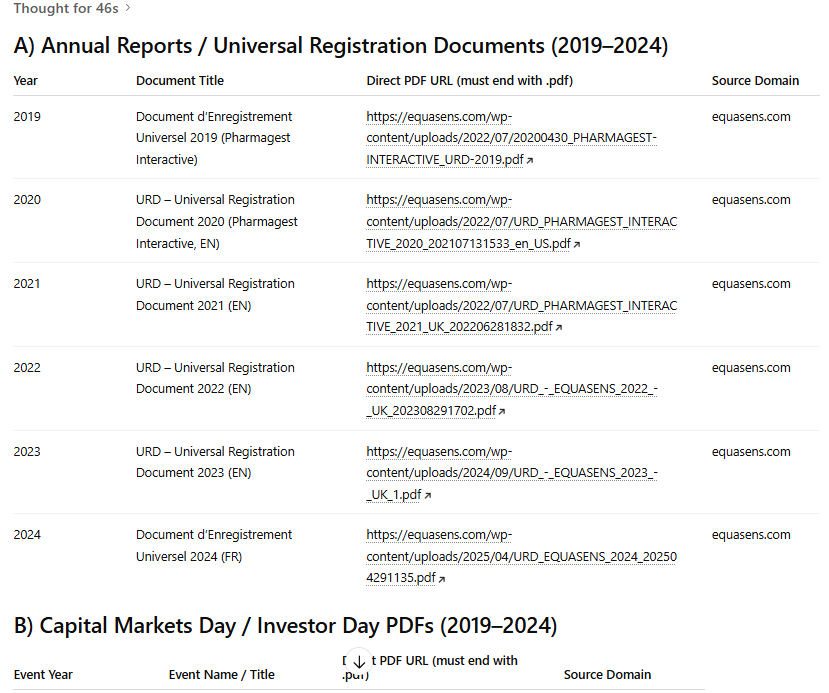
EVIDENCE RULES
Use only reliable sources:
French filings:
URD (Document d’enregistrement universel) / Annual report
Semi-annual financial report
Earnings releases + investor presentations
Earnings call transcripts (if available)
Competitor filings for industry comparison (Fnac Darty, peers, etc.)
Mark any non-factual analysis clearly as (inferred)
No blogs, no opinions, no unsupported claims.
REPORT STRUCTURE
I. EXECUTIVE SUMMARY (max 5 bullets)
Operating margin level and 5-year trend
Primary cost structure: fixed-heavy or variable-heavy?
Industry comparison: above, at, or below peers?
Classification: Structural Leverage / Partial Leverage / Labor-Based Growth
The one-sentence verdict
II. THE COST STRUCTURE ANATOMY
A. Fixed vs Variable Split
Major fixed costs (R&D, platform, brand, infrastructure, leases, overhead)
Major variable costs (COGS, fulfillment, commissions, support)
Estimate: % of total costs fixed vs variable
Comparison to competitors
B. The "Already Paid For" Test
What has already been built that future customers get almost for free?
Quantify if possible: investments, years of build
Examples: platform, logistics network, brand, store network, automation
C. Marginal Cost Reality
Cost to serve one additional customer/order
Does marginal cost decline, stay flat, or rise with scale?
Where does it structurally bottom out?
D. Margin Bridge (Gross Margin vs OPEX Leverage)
Purpose: avoid confusing temporary margin effects with true operating leverage.
Table:
Year | Gross Margin % | SG&A % of revenue | EBIT %
Decompose EBIT changes:
How much comes from gross margin expansion?
How much comes from SG&A leverage?
Identify:
Temporary drivers (pricing cycle, promotions, supply shortages, mix effects)
Structural drivers (automation, scale efficiencies, cost discipline)
Mark uncertain conclusions as (inferred).
III. THE SCALING MECHANICS
A. The "Double the Business" Question
If revenue doubled tomorrow:
What would need to scale (people, warehouses, IT, complexity)?
What would stay largely fixed?
Estimate: what % of costs would double vs remain fixed?
B. Revenue Per Employee
Table: Year | Revenue | Employees | Revenue per employee
5-year trend: rising, flat, declining?
Compare with 2–3 competitors
C. Operating Expense Behavior
Table: Year | Revenue | SG&A | SG&A %
Is SG&A growing slower than revenue (leverage) or faster (anti-leverage)?
D. Cycle Stress Test (Structural vs Temporary Leverage)
Purpose: test whether leverage ...