[옵션] 만기별 옵션의 내재확률 시각화하기 (Feat. Asymmetry님)

911GT3RS
2025.06.17조회수 219회
911GT3RS
구독자 1,988명구독중 107명
Hybrid Theory
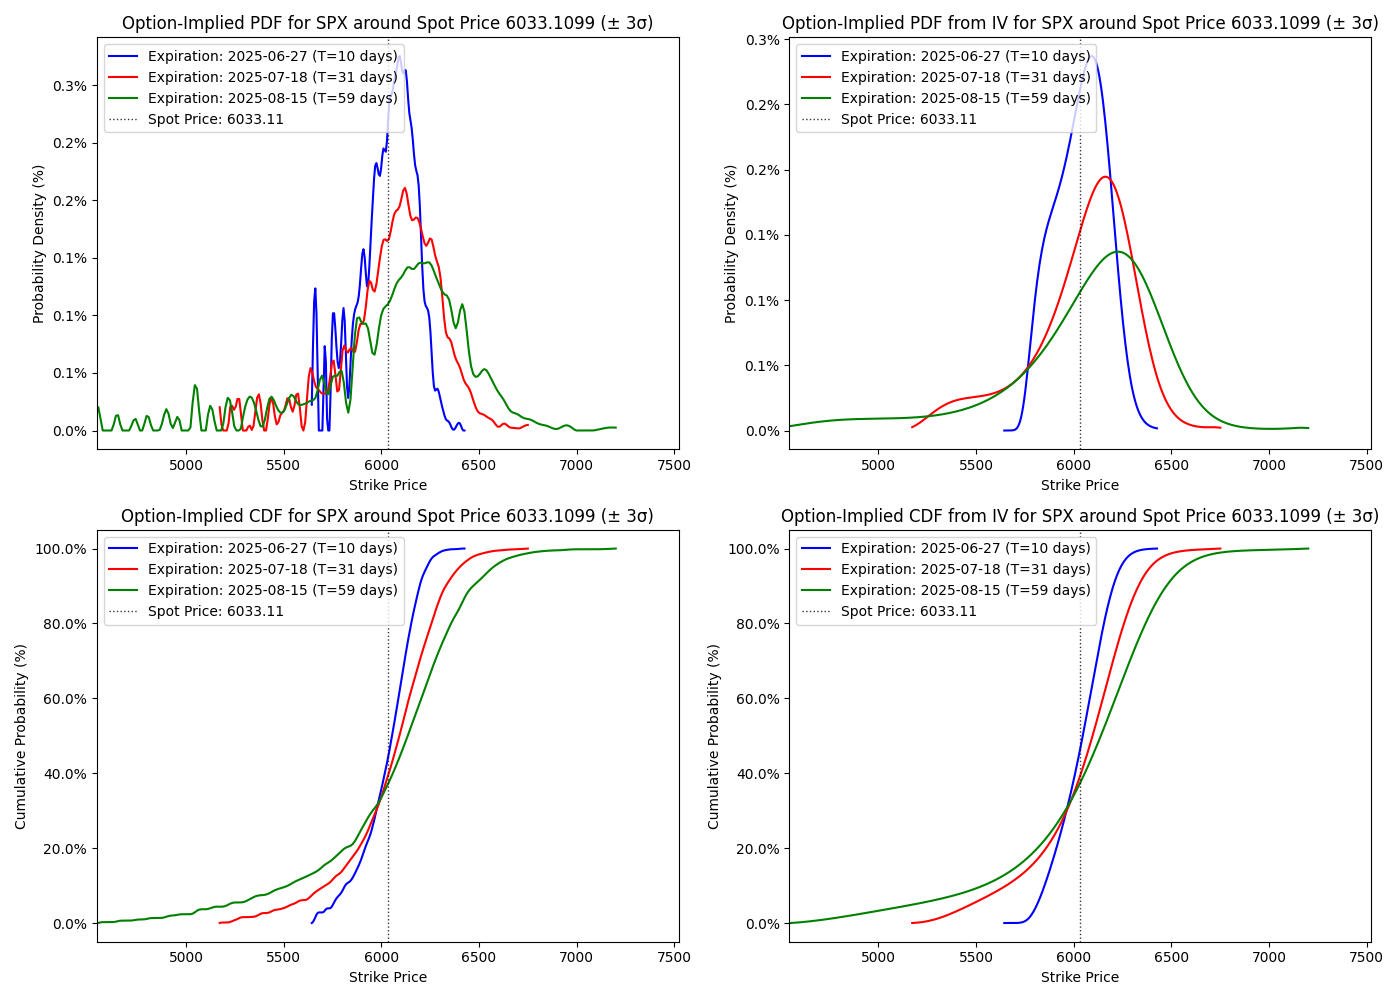
Asymmetry님의 [Repository] #002 옵션내재확률 구하기글을 참조하여, 만기별 옵션 내재확률분포를 시각화하고, 인터랙티브 차트로 구성하는 코드를 작성해봄
만기를 세개까지 동시에 비교할 수 있도록 하고, 현물 가격을 세로선으로 표시하도록 수정
굳이 인터랙티브 차트를 추가 구성해 본 이유는
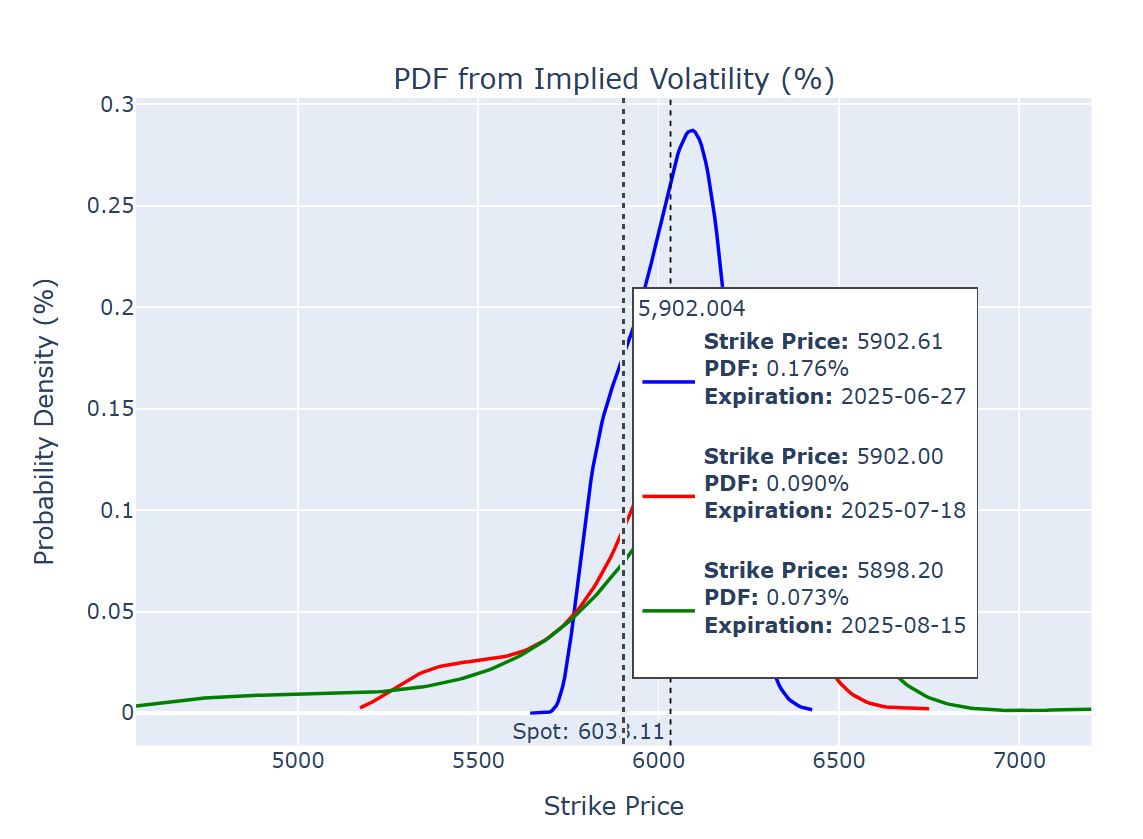
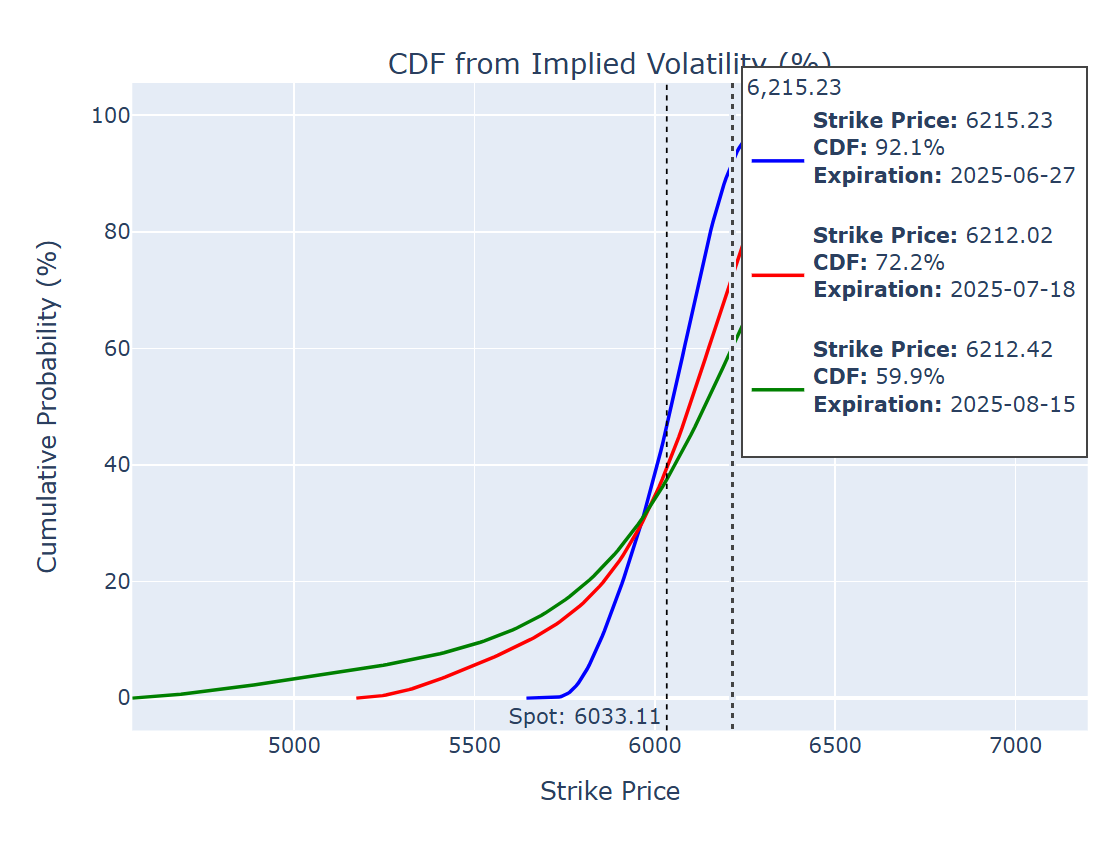
마우스를 갖다대면 내재확률(PDF)와 누적확률(CDF)가 나오기 때문에 만기에 특정 행사가 내에서 마감할 확률의 구간 추정에 용이하기 때문일 것 같아서임.
spx_quotedata 받아서 어떻게든 혼자 해보려고 Cursor 고문하다가 포기하려던 무렵, Asymmetry님이 옛날에 올려주셨던 코드를 발견해서 마개조함. (감사합니다 비대칭좌...)
이제 이를 어떻게 해석해서 실전적인 마켓뷰로 반영할 수 있는지 연구해보자.
import pandas as pd
import numpy as np
from scipy.interpolate import interp1d, UnivariateSpline
from scipy.ndimage import gaussian_filter1d
from scipy.stats import norm, skew, kurtosis
import matplotlib.pyplot as plt
from matplotlib.ticker import FuncFormatter
from scipy.optimize import brentq
from scipy.integrate import cumulative_trapezoid
import datetime
from datetime import datetime
import plotly.graph_objects as go
from plotly.subplots import make_subplots

def is_third_friday(date):
    return date.weekday() == 4 and 15 <= date.day <= 21

# Time difference calculation: seconds -> minutes -> years
def calculate_time_to_expiry(expiration_datetime):
    current_datetime = datetime.now()
    time_difference = (expiration_datetime - current_datetime).total_seconds() / 60  # Convert seconds to minutes
    time_in_years = time_difference / 525600  # Convert minutes to years
    return time_in_years

# Modified function to handle expiration filtering and time delta calculation
def process_expiration_data(option_data, target_dates):
    results = {}
    spotPrice = get_spot_price(file_path)

    for target_date in target_dates:
        print(f"\nProcessing data for expiration date: {target_date}")

        # Filter for expiration date and identify if it's the third Friday
        data_date = option_data[option_data['Expiration Date'] == target_date].copy()

        if is_third_friday(target_date):
            # Print a message confirming that we are excluding SPXW
            print(f"Third Friday identified for {target_date}, only taking SPX (excluding SPXW).")
            data_date = data_date[~data_date['Calls'].str.contains('SPXW')]  # Exclude SPXW if third Friday
        else:
            print(f"Not the third Friday. Both SPX and SPXW are included for {target_date}.")

        # Apply expiration datetime and calculate time to expiry in years
        data_date['Expiration DateTime'] = data_date.apply(assign_expiration_datetime, axis=1)
        expiration_datetime = data_date['Expiration DateTime'].iloc[0]
        T = calculate_time_to_expiry(expiration_datetime)  # Time to expiration in years
        print(f"Time to Expiration: {T} years")

        # Clean and filter valid data
        data_date = data_date.dropna(subset=['Bid', 'Ask', 'Bid.1', 'Ask.1'])
        data_date = data_date[(data_date['Bid'] > 0) & (data_date['Ask'] > 0) &
                              (data_date['Bid.1'] > 0) & (data_date['Ask.1'] > 0)]

        # Continue with further steps such as calculating mid prices, implied volatility, etc.
        # ...

        # Store results for plotting and comparison later
        results[target_date] = {
            'spot_price': spotPrice,
            'time_to_expiry': T,
            # Other results you compute...
        }

    return results


def assign_expiration_datetime(row):
    exp_date = row['Expiration Date']
    if 'SPXW' in row['Calls']:  # PM-settled SPXW (weekly options expire at 4:00 PM)
        return datetime(exp_date.year, exp_date.month, exp_date.day, 16, 0)
    else:  # AM-settled SPX (standard options expire at 9:30 AM)
        return datetime(exp_date.year, exp_date.month, exp_date.day, 9, 30)


def implied_volatility(option_price, S, K, T, r, option_type='call'):
    def bs_price(sigma):
        if sigma <= 0:
            return np.nan
        d1 = (np.log(S / K) + (r + 0.5 * sigma**2) * T) / (sigma * np.sqrt(T))
        d2 = d1 - sigma * np.sqrt(T)
        if option_type == 'call':
            price = S * norm.cdf(d1) - K * np.exp(-r * T) * norm.cdf(d2)
        else:
            price = K * np.exp(-r * T) * norm.cdf(-d2) - S * norm.cdf(-d1)
        return price

    def objective_function(sigma):
        return bs_price(sigma) - option_price

    try:
        implied_vol = brentq(objective_function, 1e-6, 5, maxiter=1000)
    except (ValueError, RuntimeError):
        implied_vol = np.nan
    return implied_vol

def bs_price(S, K, T, r, sigma, option_type='call'):
    sigma = max(sigma, 1e-6)
    d1 = (np.log(S / K) + (r + 0.5 * sigma**2) * T) / (sigma * np.sqrt(T))
    d2 = d1 - sigma * np.sqrt(T)
    if option_type == 'call':
        price = S * norm.cdf(d1) - K * np.exp(-r * T) * norm.cdf(d2)
    else:
        price = K * np.exp(-r * T) * norm.cdf(-d2) - S * norm.cdf(-d1)
    return price

def calculate_implied_pdf(prices, strikes):
    interp_func = interp1d(strikes, prices, kind='cubic', fill_value='extrapolate')
    fine_strikes = np.linspace(min(strikes), max(strikes), 500)
    prices_fine = interp_func(fine_strikes)
    price_d2 = np.gradient(np.gradient(prices_fine, fine_strikes), fine_strikes)
    return price_d2, fine_strikes

def normalize_pdf(pdf, strikes):
    pdf = np.maximum(pdf, 0)
    total_prob_before = np.trapezoid(pdf, strikes)
    if total_prob_before == 0:
        total_prob_before = 1e-6
    pdf_normalized = pdf / total_prob_before
    cdf = cumulative_trapezoid(pdf_normalized, strikes, initial=0)
    cdf_normalized = cdf / cdf[-1]
    return pdf_normalized, cdf_normalized

def normalize_pdf_within_zoomed_range(pdf, strikes, total_prob_zoomed):
    pdf_normalized = pdf / total_prob_zoomed
    cdf_zoomed = cumulative_trapezoid(pdf_normalized, strikes, initial=0)
    cdf_zoomed_normalized = cdf_zoomed / cdf_zoomed[-1]
    return pdf_normalized, cdf_zoomed_normalized

def get_spot_price(filename):
    with open(filename, 'r', encoding='utf-8') as optionsFile:
        optionsFileData = optionsFile.readlines()
    spotLine = optionsFileData[1]
    spotPrice_str = spotLine.split('Last:')[1].split('Change:')[0].strip()
    spotPrice = float(spotPrice_str.replace(',', ''))
    return spotPrice

def find_percentile(strikes, cdf, percentile):
    idx = np.abs(cdf - percentile / 100).argmin()
    return strikes[idx]

# Load the data
file_path = r'spx_quotedata.csv'
option_data = pd.read_csv(file_path, skiprows=3)

# Parse and filter by expiration date
option_data['Expiration Date'] = pd.to_datetime(option_data['Expiration Date']).dt.date

# Define the three target dates
target_dates = [pd.Timestamp('2025-06-27').date(), pd.Timestamp('2025-07-18').date(), pd.Timestamp('2025-08-15').date()]
results = process_expiration_data(option_data, target_dates)

# Get spot price
...
좋은 글 감사드립니다. 지난 번에 이야기하셨던 시각화 프로그램이 점점 완성되어가는 것 같다는 생각이 들었습니다. :)
넵 조금씩 퍼즐을 맞춰보고 있습니다! 완성되면 공유드려 보겠습니다.

진심 멋있습니다!
능력자분들이 너무 많으셔서 신세를 많이 지고 있습니다 ㅎㅎㅎㅎ

Plotly로 hover 차트까지... 대박입니다. 특정 이벤트가 껴있는 주간에서 IV가 얼마나 튀는지 시각화 하기에 좋은 것 같아요!
정말 감사합니다. 매번 많이 배우고 있습니다!

어후 비대칭좌 대단쓰
Valley의 빛...
![[옵션] 옵션 시장 대시보드 만드는 중](https://post-image.valley.town/V4bjyzI4itBMBfqNAhUov.png)
![[옵션] 조정일 것인가, 폭락일 것인가?](https://s3.lol.ps/file/lol-ps/media/django-summernote/2021-02-23/be51f132-cdb9-4a31-b6fc-709515279fa1/1bee9b02-c31b-4536-bacb-47cbb964b452.jpg)
![[옵션] 옵션시장을 통해 테슬라가 오를지 내릴지 예상해보는 방법](https://cdna.artstation.com/p/assets/images/images/039/045/266/large/jelly-wings-title1.jpg?1624805471)
![[옵션] Market Gamma만 믿고 매매하면 어떻게 될까?](https://post-image.valley.town/7i0ZI9q5sFChTr8jpjI3H.gif)