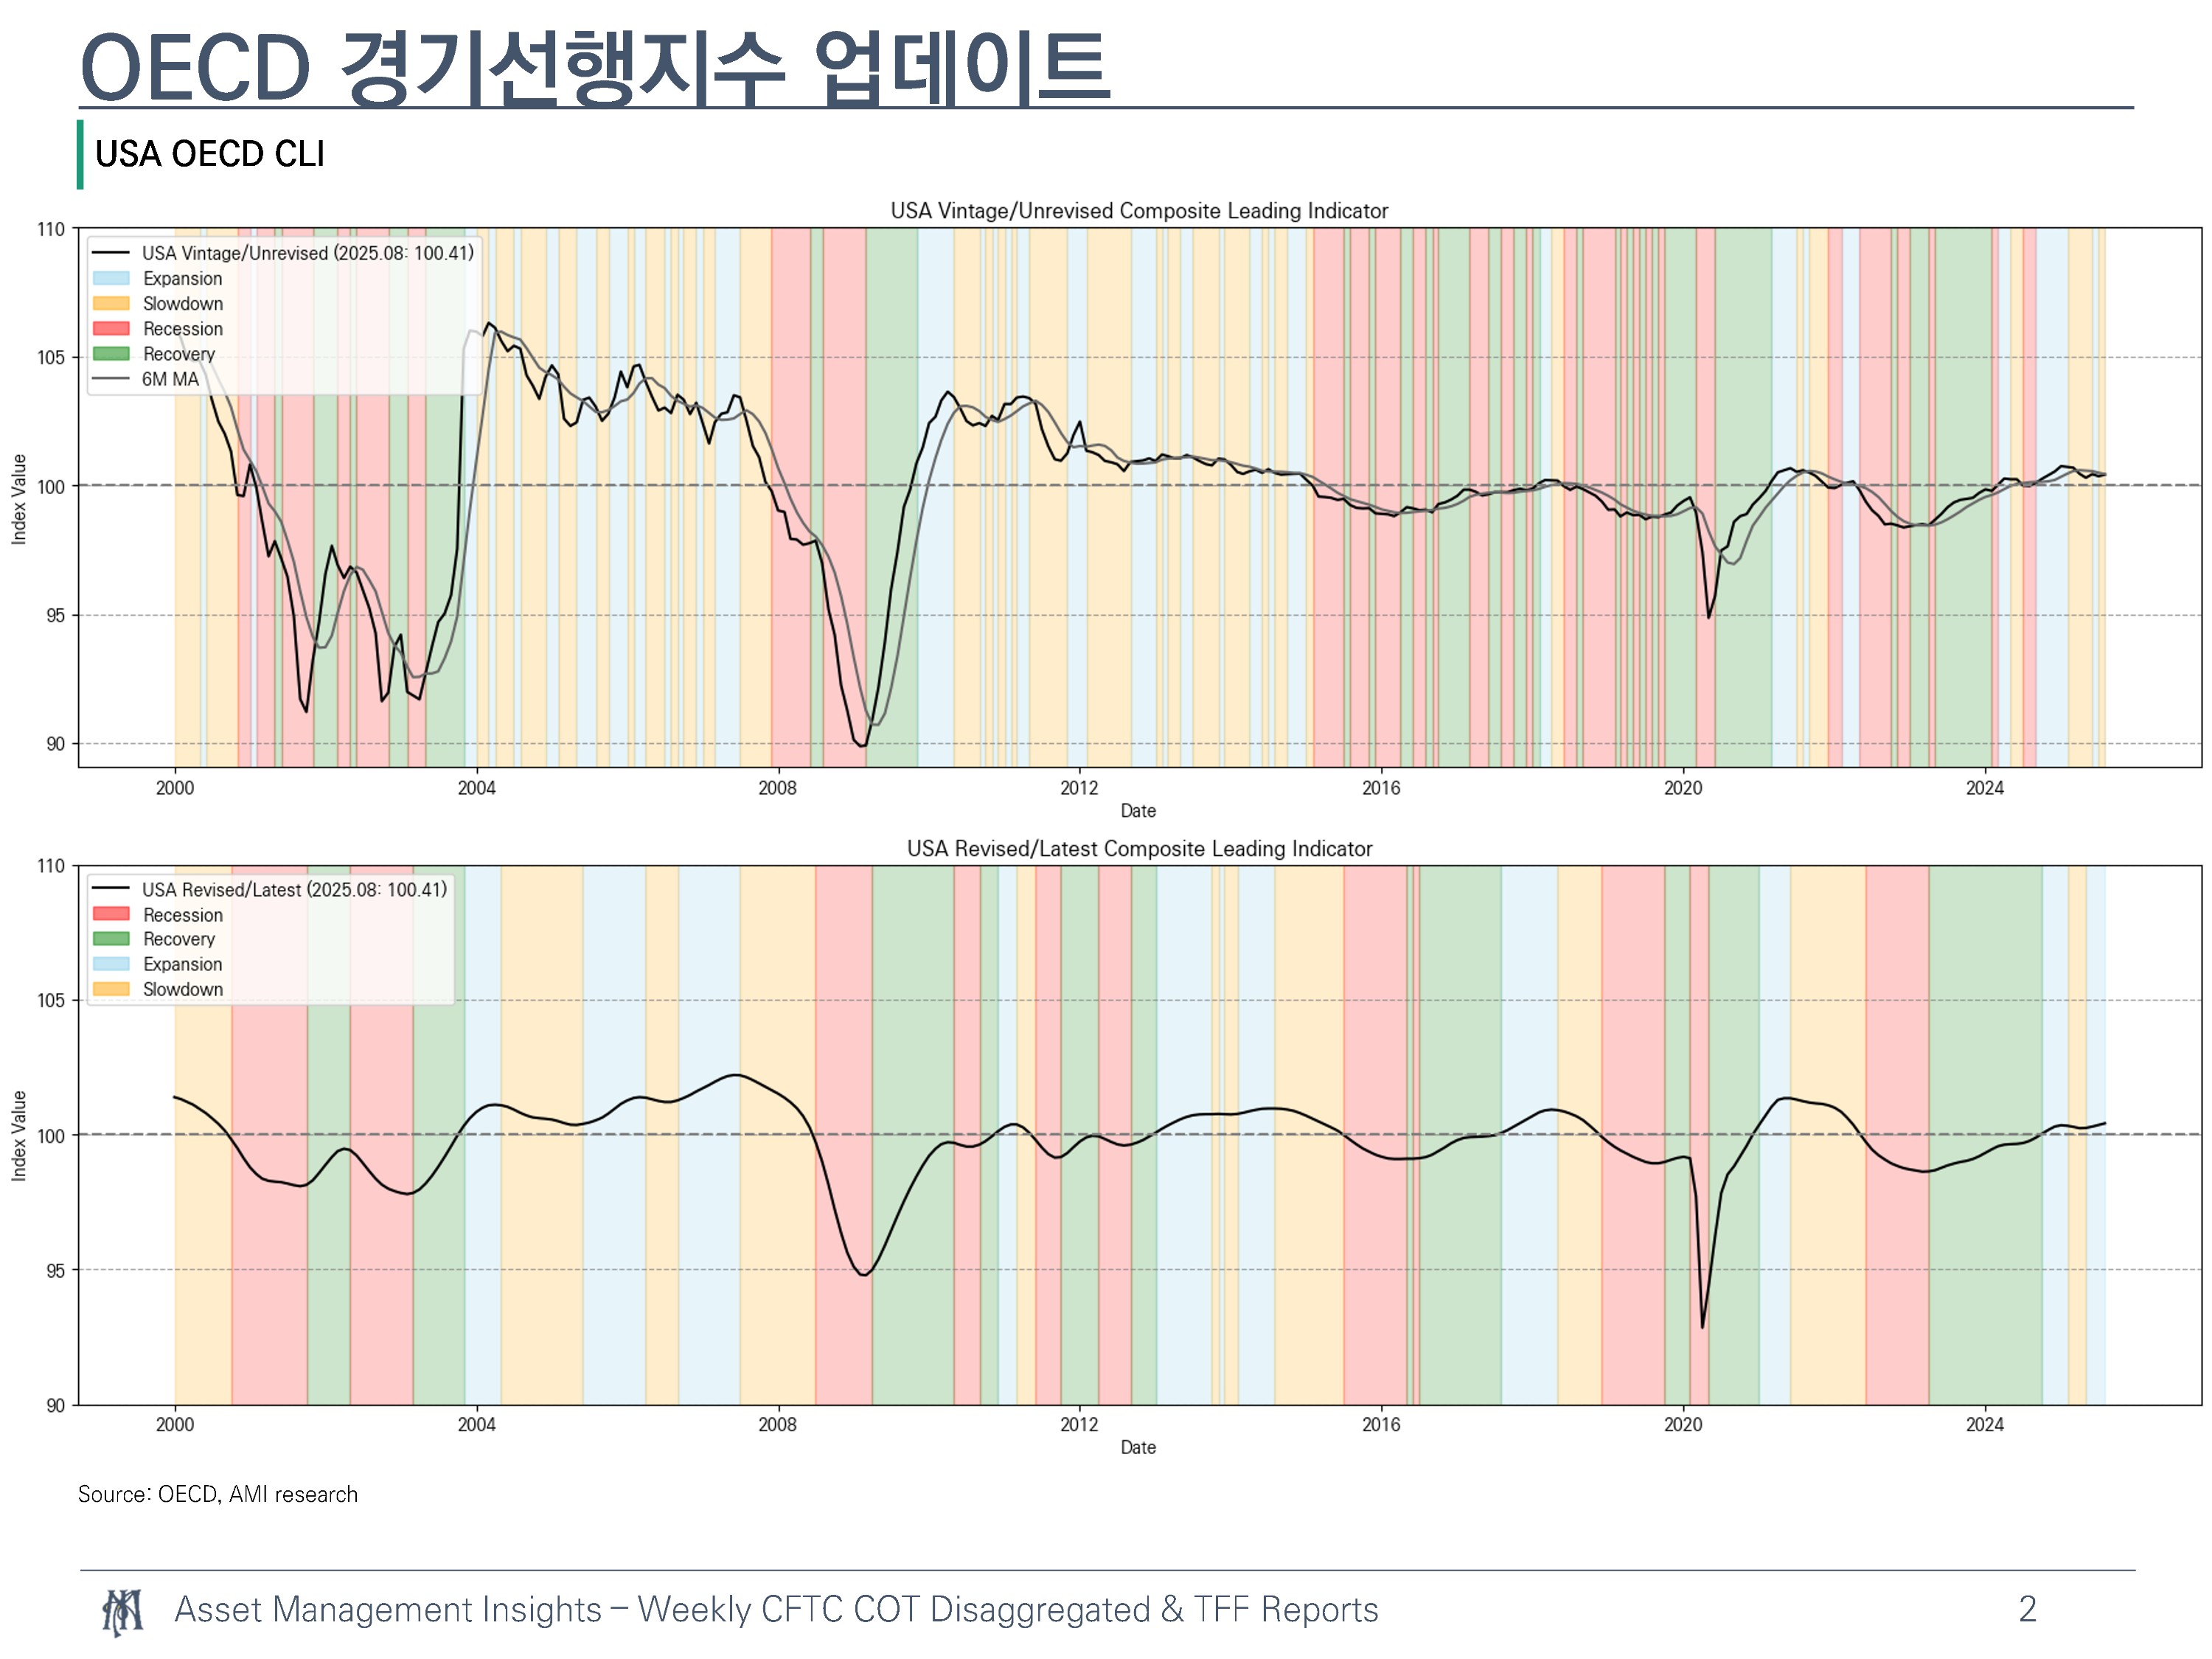
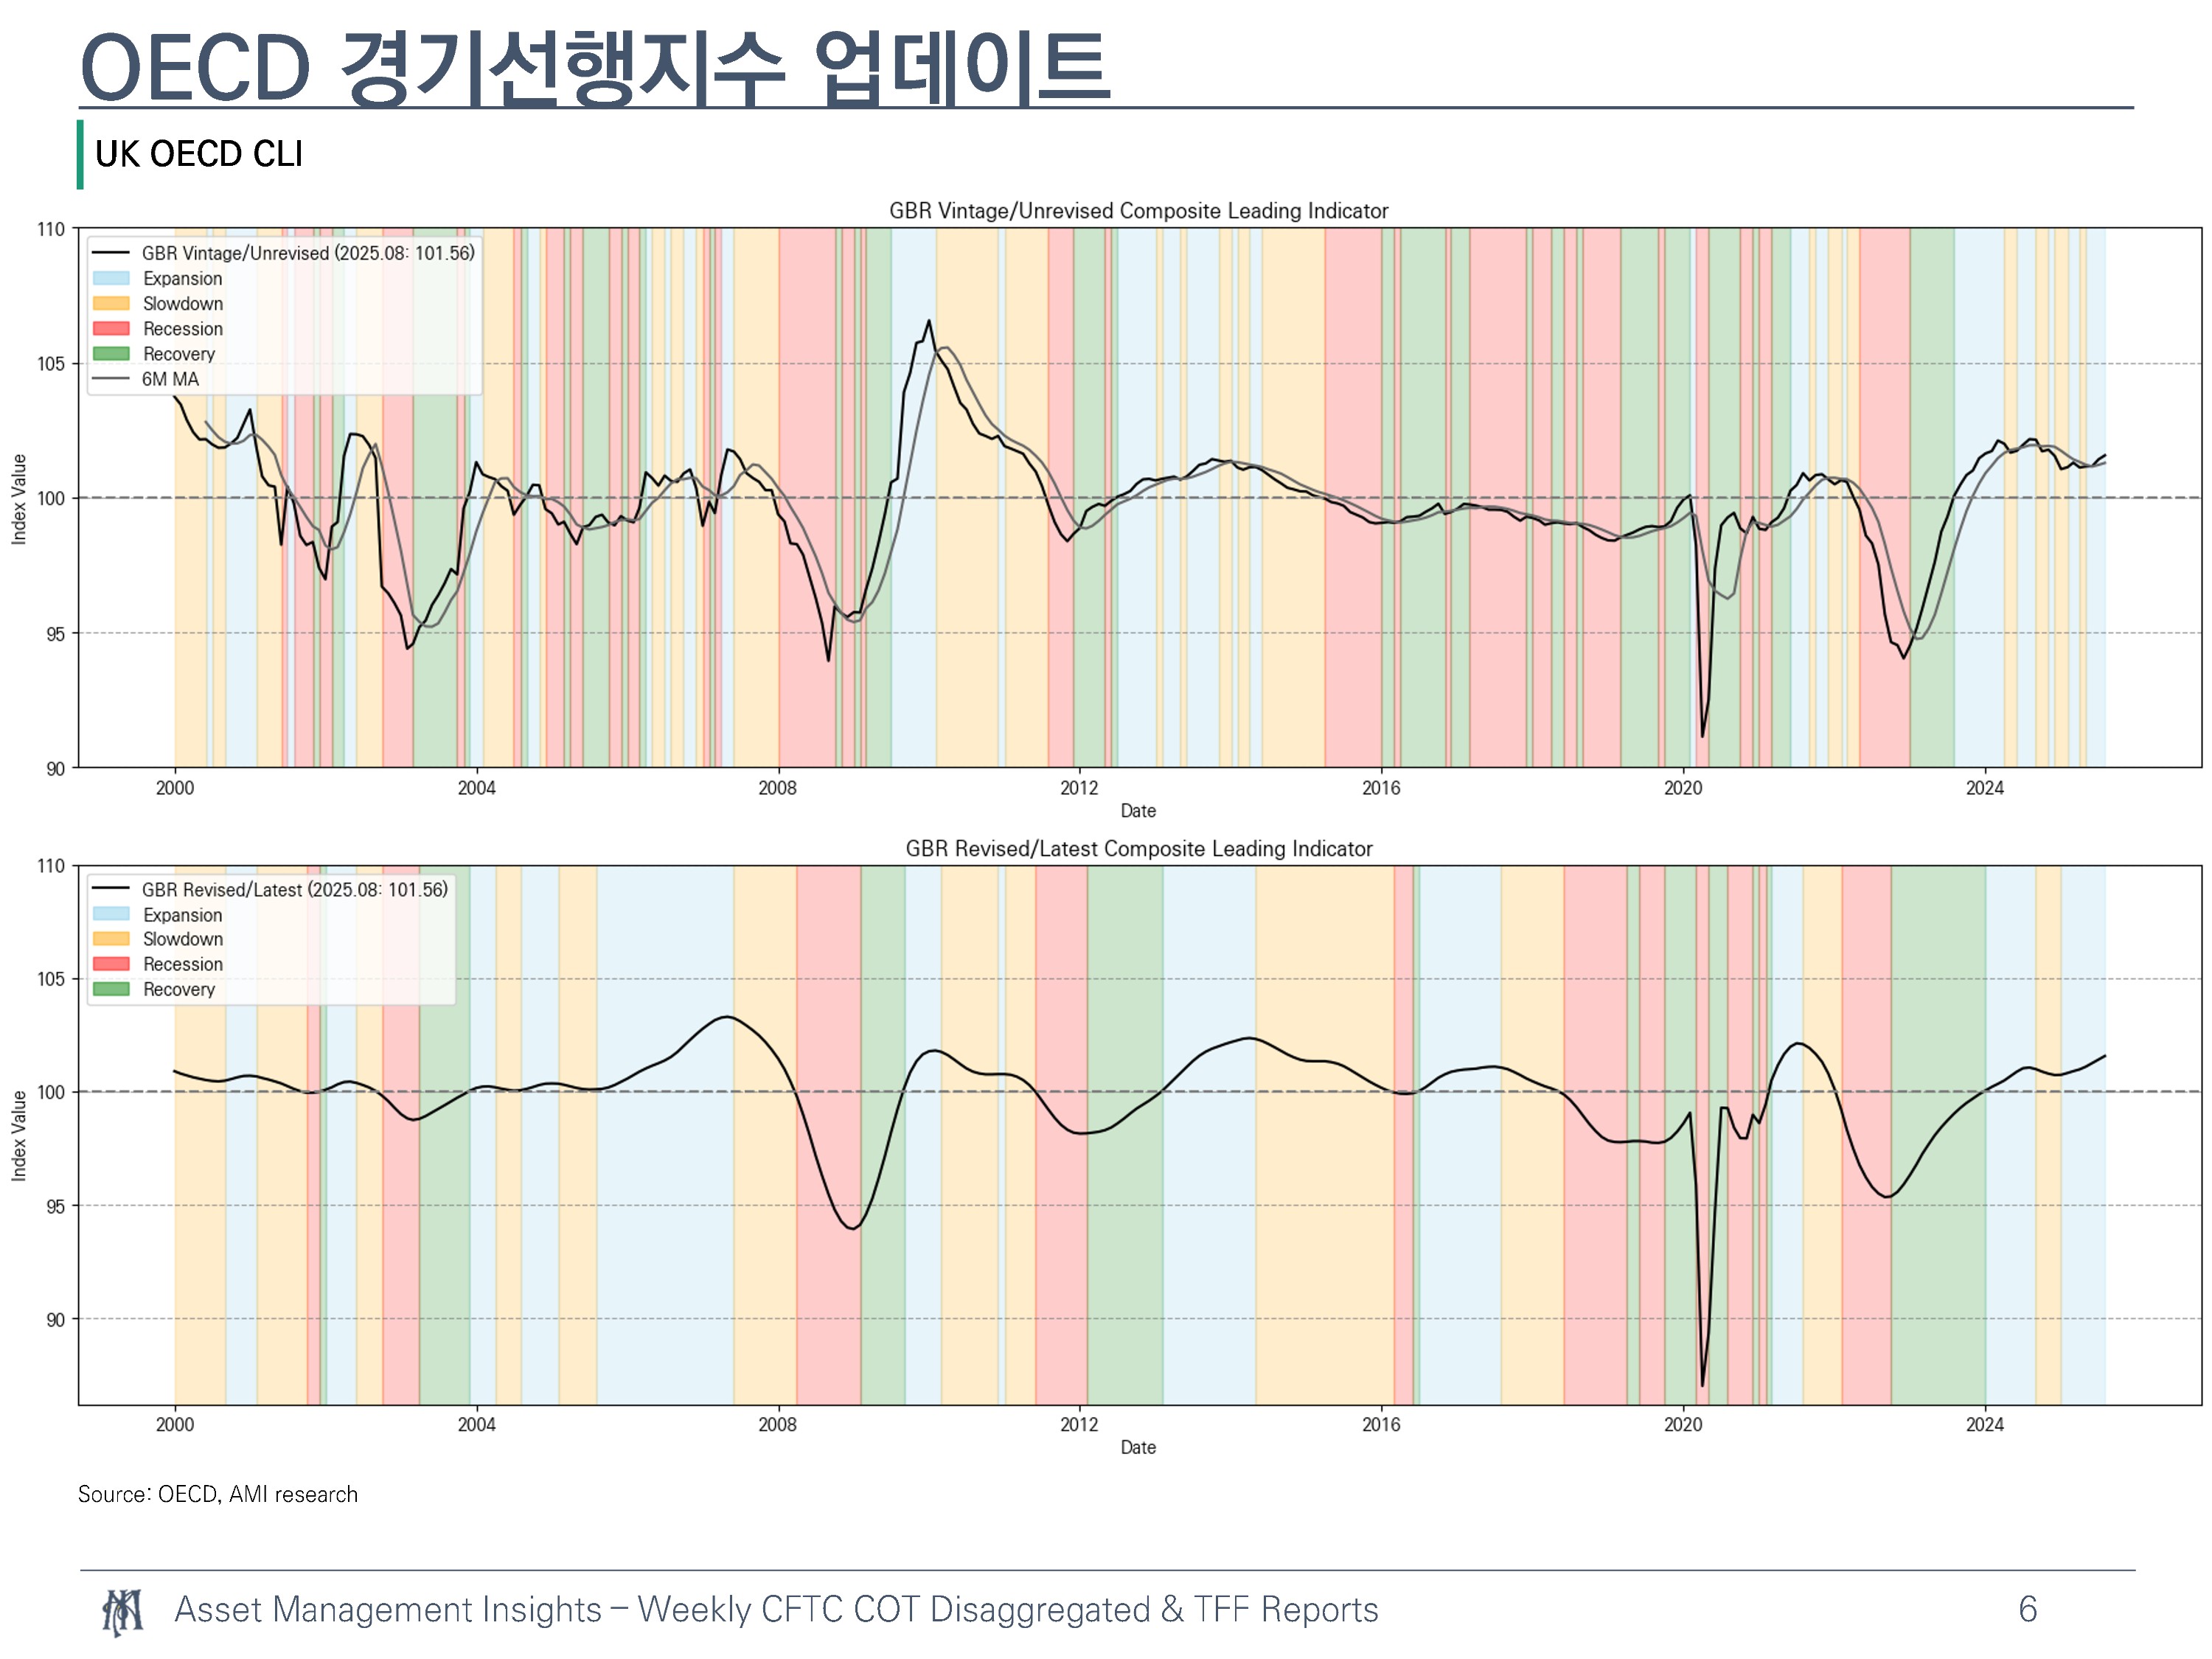
빈티지 데이터란?
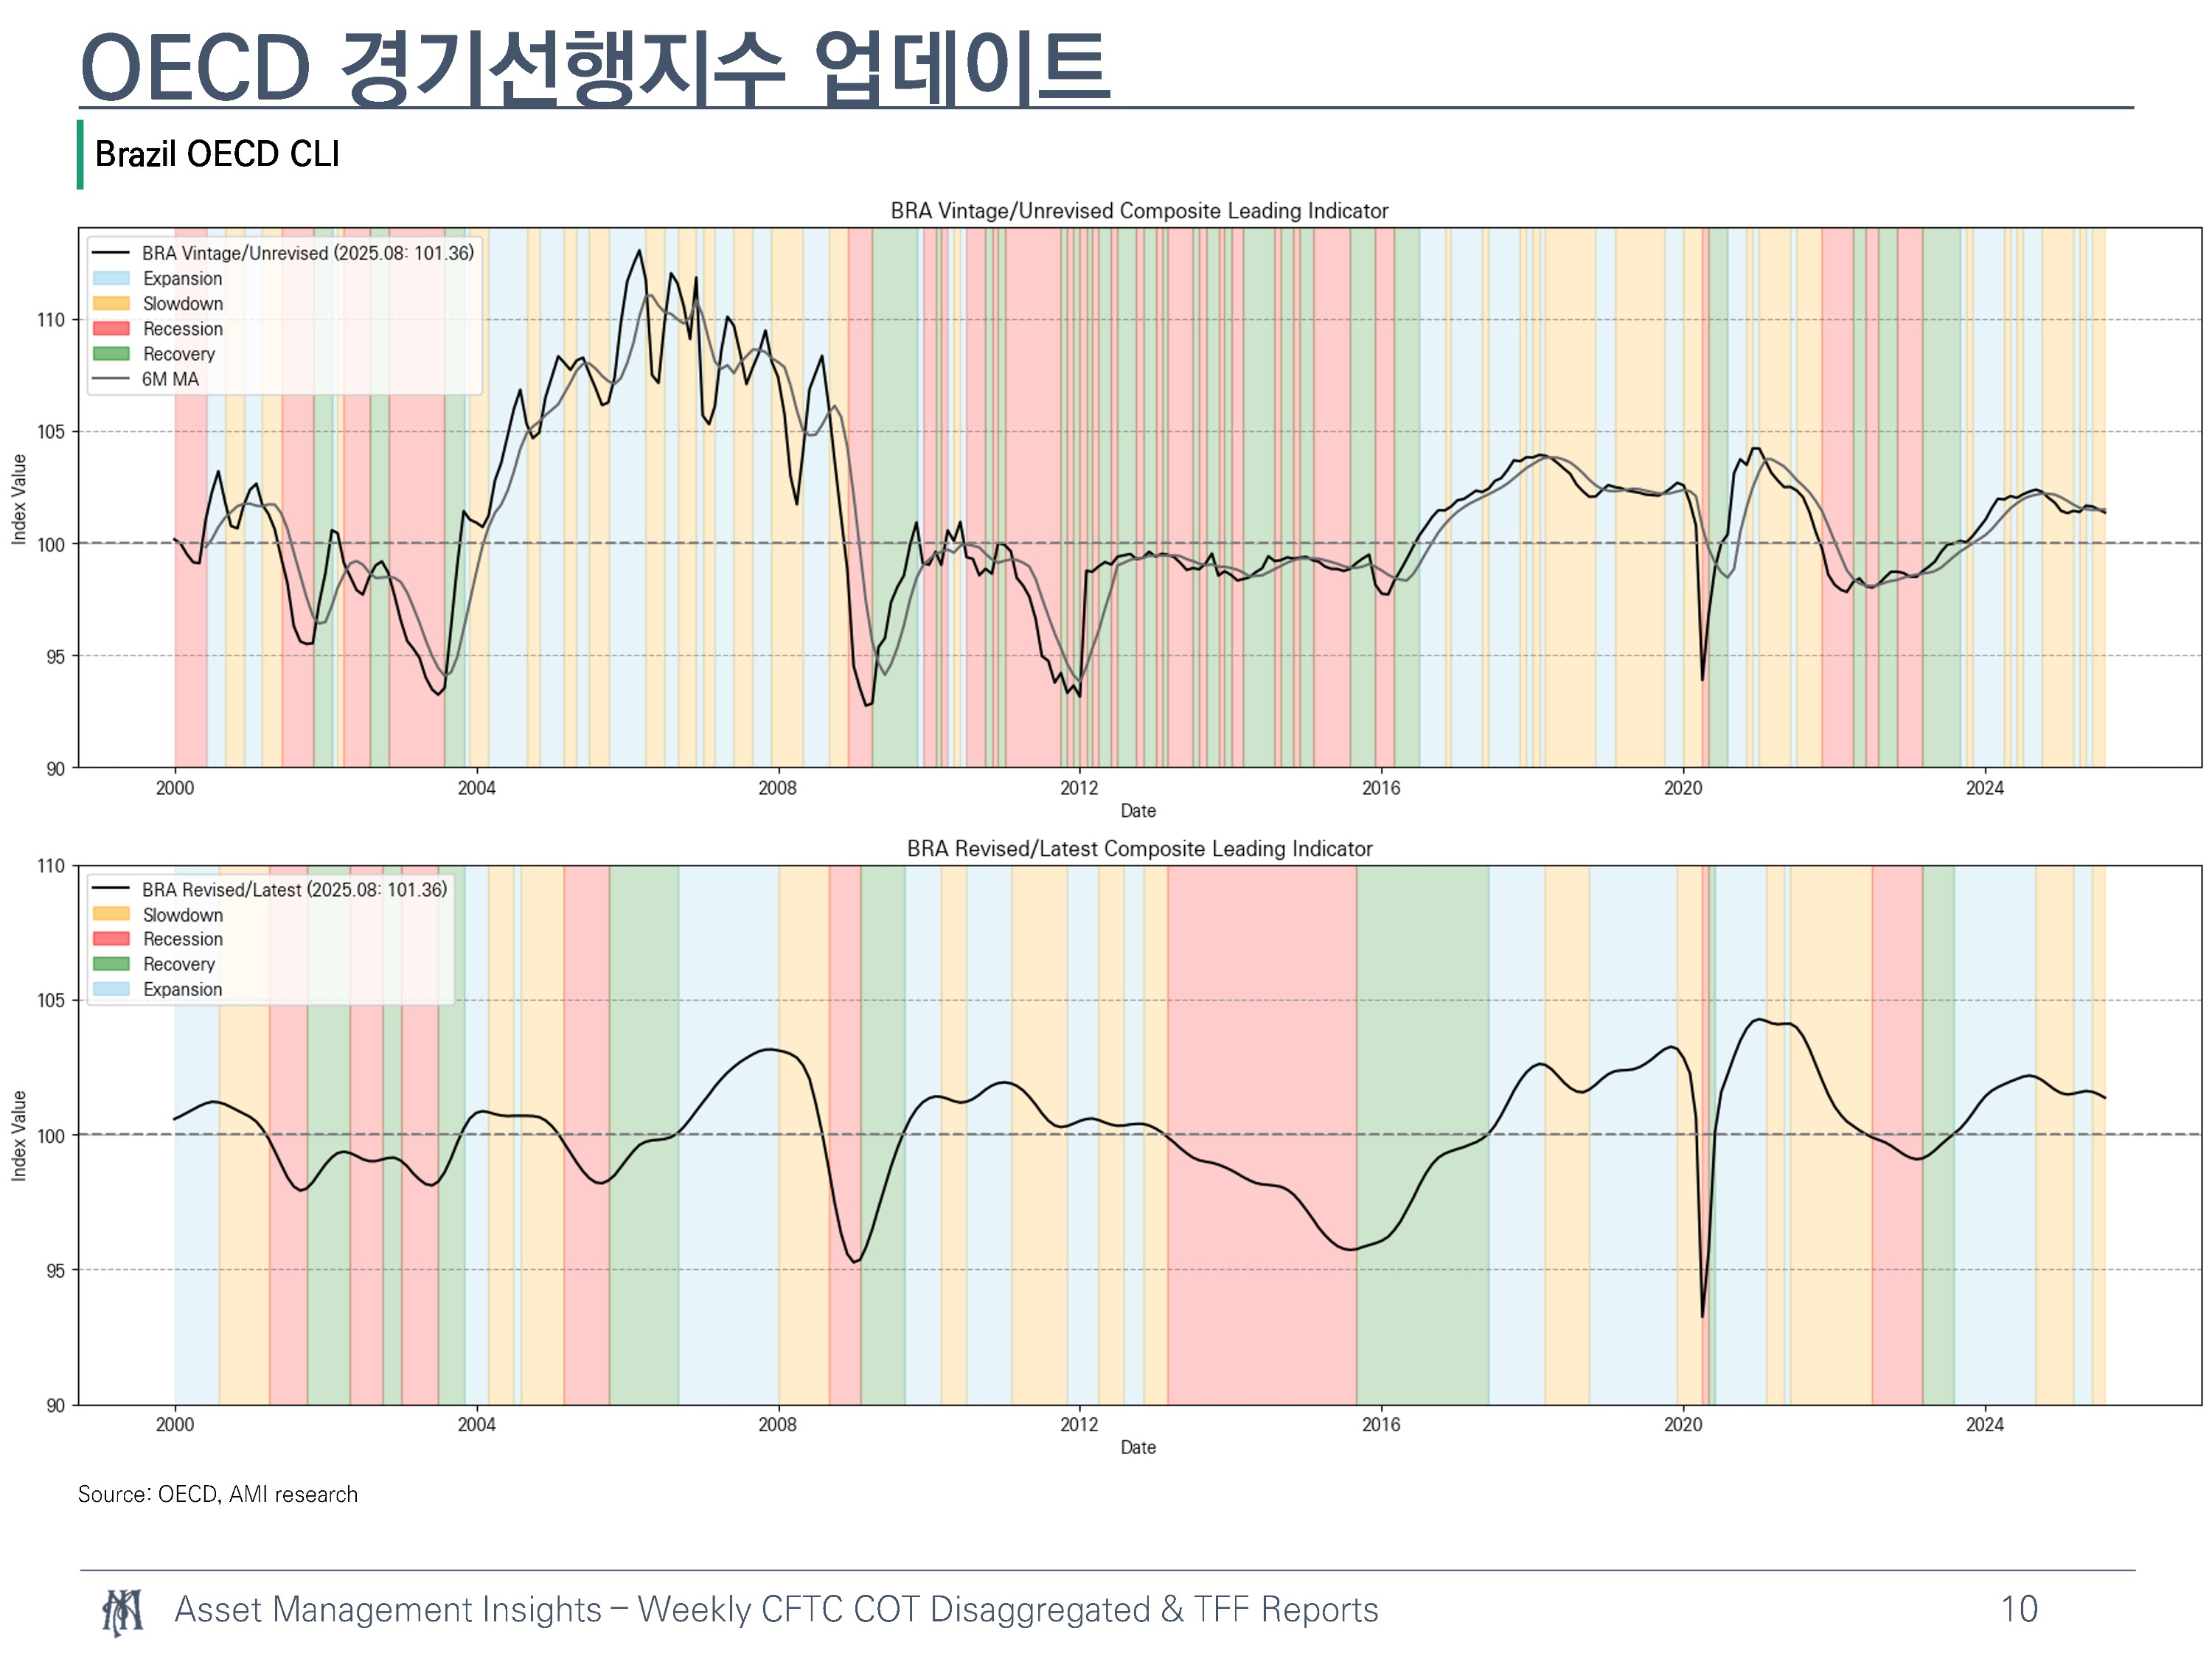
: 빈티지 데이터는 통계가 “처음 공표된 시점 그대로”의 값, 즉 개정 전 값을 시점별로 보존한 실시간 데이터 묶음을 뜻한다. 사이트에서 일반적으로 조회 가능한 데이터는 수정된 수치로 실제 과거 시점에서 사용 가능한 데이터가 아니다. 전략 백테스트와 예측 평가에서 미래 개정 정보를 몰랐던 당시 상황을 재현해 개정 전 값으로 의사결정을 검증하는 데 사용된다.
Vintage 데이터와 Revised 데이터를 활용한 의사결정의 차이 예시: 자산군 수익률 분포
================================================================================
📊 CLI REGIME별 자산 수익률 통계 분석,
기준: USA CLI, Vintage
================================================================================

🔹 2-regime (Level)
----------------------------------------------------------------------

📈 Above 100:
           Asset  Count Mean (%) Median (%)    Std   Skew Kurtosis
         S&P 500    152     0.65       1.21 0.0350 -0.419    0.423
  Comm. Services    152     0.24       0.78 0.0456 -0.646    0.731
  Consumer Disc.    152     0.62       0.72 0.0447 -0.183    0.626
Consumer Staples    152     0.89       1.08 0.0308  0.297    0.554
          Energy    152     1.22       1.42 0.0589 -0.069    1.088
      Financials    152     0.70       1.27 0.0458 -0.241    0.392
     Health Care    152     0.89       1.12 0.0345 -0.159   -0.226
     Industrials    152     0.74       0.96 0.0415 -0.023    0.524
       Info Tech    152     0.45       1.21 0.0569 -0.699    1.160
       Materials    152     0.60       0.70 0.0506 -0.108    1.384
     Real Estate    143     0.98       1.33 0.0490 -0.279    0.291
       Utilities    152     0.98       1.27 0.0384 -0.205    0.473
        KOSPI200    152     0.33       0.26 0.0546 -0.256    0.680

📈 Below 100:
           Asset  Count Mean (%) Median (%)    Std   Skew Kurtosis
         S&P 500    153     0.54       1.07 0.0510 -0.533    0.440
  Comm. Services    153     0.32       0.66 0.0675  0.358    2.281
  Consumer Disc.    153     0.95       0.85 0.0654  0.042    0.792
Consumer Staples    153     0.29       0.73 0.0366 -0.563    0.425
          Energy    153     0.03      -0.14 0.0785  0.113    4.167
      Financials    153     0.36       0.12 0.0724 -0.658    2.261
     Health Care    153     0.27       0.67 0.0437 -0.288    0.125
     Industrials    153     0.56       0.81 0.0626 -0.463    1.178
       Info Tech    153     1.25       1.84 0.0779 -0.464    1.201
       Materials    153     0.71       0.77 0.0653 -0.263    0.590
     Real Estate    141     0.15       0.83 0.0724 -0.502    6.956
       Utilities    153    -0.13       0.80 0.0515 -0.516    0.138
        KOSPI200    153     1.11       1.09 0.0665  0.061    1.002

🔹 2-regime (Direction)
----------------------------------------------------------------------

📈 Increasing:
           Asset  Count Mean (%) Median (%)    Std   Skew Kurtosis
         S&P 500    141     0.60       1.11 0.0405 -0.354    0.827
  Comm. Services    141     0.10      -0.08 0.0545 -0.374    0.214
  Consumer Disc.    141     0.67       0.75 0.0536 -0.023    1.198
Consumer Staples    141     0.42       0.70 0.0309 -0.143   -0.239
          Energy    141     0.60       0.48 0.0768 -0.047    4.731
      Financials    141     0.63       0.47 0.0546 -0.279    1.444
     Health Care    141     0.53       0.86 0.0368  0.019    0.216
     Industrials    141     0.45       0.85 0.0486 -0.484    1.850
       Info Tech    141     0.97       1.37 0.0553 -0.406    0.196
       Materials    141     0.43       0.56 0.0555 -0.278    0.723
     Real Estate    137     0.69       0.83 0.0474 -0.165    0.324
       Utilities    141     0.26       0.82 0.0437 -0.516    0.580
        KOSPI200    141     0.91       1.38 0.0558 -0.080    0.190

📈 Decreasing:
           Asset  Count Mean (%) Median (%)    Std   Skew Kurtosis
         S&P 500    164     0.59       1.14 0.0464 -0.645    0.838
  Comm. Services    164     0.44       1.14 0.0602  0.446    4.014
  Consumer Disc.    164     0.88       0.93 0.0581  0.041    1.266
Consumer Staples    164     0.74       1.08 0.0364 -0.396    1.074
          Energy    164     0.63       0.87 0.0630  0.047    1.451
      Financials    164     0.44       1.49 0.0654 -0.810    3.325
     Health Care    164     0.61       1.04 0.0417 -0.496    0.190
     Industrials    164     0.82       1.05 0.0567 -0.384    1.523
       Info Tech    164     0.75       1.59 0.0778 -0.473    1.286
       Materials    164     0.85       0.87 0.0608 -0.185    1.163
     Real Estate    147     0.45       1.12 0.0728 -0.575    6.512
       Utilities    164     0.57       1.14 0.0475 -0.558    0.633
        KOSPI200    164     0.55       0.31 0.0651  0.043    1.359

🔹 4-regime
----------------------------------------------------------------------

📈 Expansion:
           Asset  Count Mean (%) Median (%)    Std   Skew Kurtosis
         S&P 500     69     0.33       0.94 0.0342 -0.663    0.436
  Comm. Services     69    -0.19      -0.39 0.0459 -0.471    0.910
  Consumer Disc.     69     0.33       0.61 0.0493 -0.280    0.660
Consumer Staples     69    -0.01      -0.35 0.0287  0.088   -0.620
          Energy     69     1.12  ...