동료 주식 투자자 여러분께
투자자로서 제가 가장 좋아하는 습관 중 하나는 과거의 분석들을 다시 살펴보는 것입니다. 제가 연구했다가 매수하지 않고, 그래도 계속 추적했던 종목들 말이죠.
2020년으로 돌아가, 저는 두 개의 프랑스 동물 건강 회사인 비르박(Virbac)과 베토퀴놀(Vetoquinol)을 검토했습니다. 두 회사 모두 반려동물 인간화(pet-humanization) 트렌드를 타고 있었습니다. 하지만 저는 매수하지 않았습니다.
5년 후, 두 회사 모두 지수에는 뒤처졌습니다. 하지만 여전히 비르박이 베토퀴놀보다 50%나 더 좋은 성과를 냈습니다.
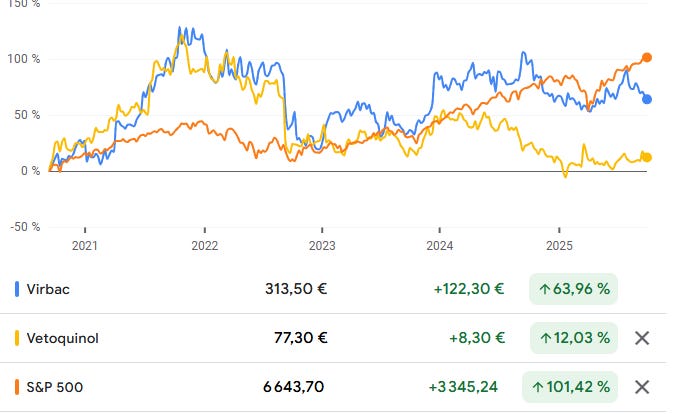
같은 산업. 다른 결과.
이것이 바로 교훈입니다. 같은 산업에 속해 있다고 해서 같은 수익을 가져다주는 것은 아닙니다.
그렇다면 어떻게 이 차이를 조기에 포착할 수 있을까요?
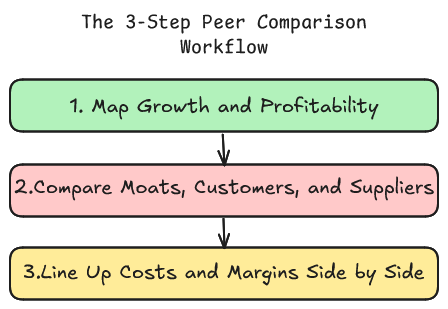
보통은 수일 간의 공시 자료 검토, 컨퍼런스 콜 청취, 노트 정리 등의 시간이 필요합니다. 하지만 이 3단계 AI 워크플로우는 그 과정을 단 37분으로 압축합니다.
핵심은 일을 건너뛰는 것이 아닙니다. 어떤 회사에 먼저 노력을 투자해야 할지 아는 것입니다. 왜냐하면 시간이야말로 여러분의 가장 희소한 자원이기 때문입니다. 그리고 이 워크플로우는 여러분이 가장 높은 성과를 얻을 수 있는 곳에 시간을 쓰도록 보장해 줍니다.
단계 1: 성장과 수익성 지도 그리기
첫 번째 단계는 간단합니다. 성장과 수익성이 실제로 어디에서 오는지 찾아내는 것입니다. 회사 전체 수준이 아니라, 제품 및 지역 수준에서 파악해야 합니다. 바로 이 지점에서 두 회사의 차이가 드러납니다.
어떤 회사가 더 강력한 성장 프로필(제품 × 지역별)을 가지고 있는가
어떤 회사가 그 성장을 우월한 마진으로 전환시키는가
상황이 바뀌었을 때 취약점은 어디에 있는가
'부문-지역 스코어카드'라는 간단한 도구가 여러분의 투자 가설을 확고히 해 줄 것입니다. 이 프롬프트를 한 번 실행하면 몇 분 만에 성장, 수익성, 그리고 위험 요소를 깔끔하게 정리한 지도를 얻을 수 있습니다.
기업 이름 A, B 입력
산업 입력
통화 입력
Act as a comparative business analyst and generate a consulting-style dossier contrasting {Company A} and {Company B} within the {Industry}. Focus on evidence-led analysis using the 80/20 principle to highlight critical components.
Objective:
- Identify which company has a higher probability of growth over the next 5-10 years, focusing on product segments and geographies.
- Determine which company exhibits superior profitability and margin profiles linked explicitly to product segments and geographies.
Inputs:
- Peers: {Company A}, {Company B}
- Industry: {Industry}
- Currency: {Currency} (state FX basis if converted)
Source Policy:
Utilize primary/high-signal sources such as audited reports, investor decks, earnings call transcripts, regulator databases, and expert market research. Append sources to each exhibit as: [Source: Title — URL — Doc date]. Use “ND” for missing data and tag inferences with brief logic. Apply ISO date format.
Normalization:
Standardize product and region labels across companies. Align channel terms. Use reporting currency; note FX basis for conversions.
Output Format:
Markdown format with tables first, and short narrative per exhibit: Context → Insight → Implication → KPI, including direct A-vs-B comparisons throughout.
1. Executive Summary
- Growth call: Declare which business has a greater growth probability based on product × geography, including 2–3 factual reasons.
- Profitability call: State which business has better margin/earnings quality, tied to specific segments and geographies.
- Identify 3 growth drivers explaining future growth odds.
- Highlight 3 vulnerabilities that might flip growth margins.
- Provide a Segment–Geography scorecard (0–5).
- Outline 3 business KPIs for the next 12–24 months.
2. SECTION A — Top Cells: Analyze top products by country.
3. SECTION B — Price Control & Route-to-Market: Assess net price realization efficiency.
4. SECTION C — Supply Resilience: Evaluate supply sourcing and continuity.
5. SECTION D — Segment Growth Engines: Examine growth drivers and profitability.
6. SECTION E — Product & Geography ...